Layers of automation
Table of contents
- Introduction
- Automation, yes, but which automation?
- What is automation
- Layers of automation
- Layer relationship to each other
- Primary layers
- Horizontal Secondary layers
- Vertical Secondary layers
- Using a concrete example
- Infrastructure layer
- Service layer (I)
- Service layer (II)
- Secondary automation layers for the service level of our example
- Application Layer
- Relationship between Build - Test - Deploy automation layers
- Build job automation
- Test automation
- Deployment automation
- Service discovery automation
- Monitoring and alerting automation
- Conclusion
Introduction
This material is taken from a presentation I have given several times on several forums in the past. It is about automation and the various forms it takes in an organisation.
I believe that most organisations are not aware of the various types that are in play, and this is why I think that this material should become available as a blog post for a wider audience.
Automation, yes, but which automation?
- Automation is great, but it is a horribly overloaded term.
- Lots of people use it to describe entirely different things, leading to confusion.
- This is an attempt to highlight the various types of automation in place on an average SaaS environment.
What is automation
According to the International Society of Automation, automation is:
the creation and application of technology to monitor and control the production and delivery of products and services
and people who are involved in automation include:
everyone involved in the creation and application of technology to monitor and control the production and delivery of products and services
As we can see, this is a pretty wide definition, and we need to break it down in order to understand it in the context of a build and deployment environment.
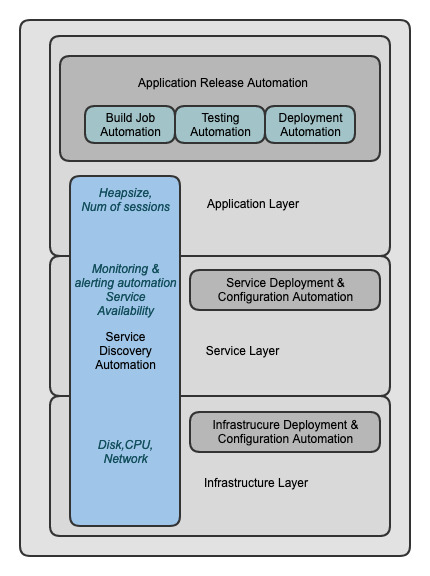
Layers of automation
The layers of automation that can be identified in a traditional setup can be seen in the following diagram. We will proceed to explain each one of them in the following sections.
Layer relationship to each other
We can divide our automation layers into two large categories:
- Primary automation layers
- Horizontal and vertical secondary automation layers
Primary layers are easily identifiable high-level layers of our tech stack that exist independently of the actual technologies in use and can in themselves contain other secondary layers of automation. Quite often, these secondary layers depend on the primary-level automation to be already in place.
Primary layers
We can identify three primary layers:
- Infrastructure layer (our virtual machine or base container)
- Service layer (our Tomcat or database server)
- Application layer (our actual application deployed in the previous service)
Horizontal Secondary layers
Horizontal secondary layers are not standard and may vary depending on environment and tech stack. For demonstration purposes, we will analyze here a classic Java application with a database backend.
The primary layer with the most secondary automation layers is the Application layer. In it, we can identify the following horizontal secondary automation layers:
- Build job automation
- Testing automation
- Deployment automation
Vertical Secondary layers
In some cases, we have secondary automation layers that cross more than one primary level vertically. We can identify the following common vertical secondary layers:
- Service discovery
- Monitoring
- Alerting
Using a concrete example
The various layers have different demarcation points depending on the project they define. In order to more easily understand the automation layers concept, we will use a typical example that consists of:
- A Java web service with JMX support
- Tomcat 8
- PostgreSQL DB server
- Red Hat Linux OS
Infrastructure layer
The infrastructure layer consists of the lower-level functions of the operating system. It is usually automated by using Chef, Puppet, SaltStack, etc., in regards to basic OS patches, security fixes, etc., usually installing packages available in the various official repos.
In secondary automation layers, we can identify system-level monitoring/alerting and node service discovery. Both of these can be rolled out using the same automation tools.
Secondary automation layers
Usually, system-level automation is responsible for installing updates needed in the system and creating service accounts needed for system maintenance. Monitoring is responsible for exposing low-level system metrics such as CPU, memory and disk usage, disk health, and disk/network I/O, etc.
If metrics are out of their acceptable ranges, alerts should be triggered in order to notify the team responsible for system maintenance.
Containers at the infrastructure layer
We can have parts of the infrastructure layer in containers, but even those will have to run on another infrastructure layer, which has to be automated as well. This layer, which is used to host the containers, is invisible only if we are using a hosted container orchestration solution such as GKE, Amazon EKS, or Azure AKS.
In those cases, our container infrastructure automation tools are effectively the same as those we use on the service layer, covered in the next section.
Service layer (I)
In our example, service layer automation is responsible for deploying the necessary services our web application relies on. In this case, our dependencies are Tomcat and PostgreSQL.
There are two main methods of automating the service layer.
Containers as an automation technology
We can use containers for both PostgreSQL and Tomcat. In this case, the Infrastructure and Service layers are merged with the Application layer because a container will contain the OS, Tomcat, and our web application. In order to deploy our service, we will need to choose one of a collection of container orchestration solutions.
The sophistication of these technologies varies from relatively simple Docker Compose scripts to full-fledged OpenShift/Helm definition files that can combine the service deployment with monitoring and alerting.
In this scenario, container orchestration takes care of all additional secondary automation layers. We get service discovery, service health monitoring, and alerting for free out of the box. These layers are natively supported by container hosting solutions such as Kubernetes, Swarm, OpenShift, etc.
It is obvious that this approach provides significant benefits and flexibility, and this is the main reason why containers have become so popular.
Although containers will work fine for our example, they may not work for all applications. There are a lot of technologies that are not yet compatible with containers and a lot of projects that are not designed in a way that can be deployed in containers. In these cases, we need to use an alternative approach.
Service layer (II)
Automating the service layer using configuration management systems
The same technologies that can be used to automate the infrastructure layer can also be used to automate the service layer. The context is slightly different. The automation scripts are not related to widespread system changes as they were in the infrastructure layer, but are focused on just a few services. In our case, the scripts are focused on the deployment of PostgreSQL and Tomcat.
The scripts will download the binaries either from the official distribution RPM repos or from third-party binary repos such as Maven Central and the official PostgreSQL Yum repos, and install them by either using the internal RPM installation scripts or external scripts designed by the automation engineer.
The automation scripts will make sure that all the configuration files are in the desired state, any service accounts are created, and any database initialization is performed. At the end of this automation execution, the services will be up and running, ready for the web application deployment.
Secondary automation layers for the service level of our example
When using configuration management systems to automate the secondary automation layers—monitoring, alerting, and service discovery—we may need to enable native support of the service we are automating for all these things, or more often to provide service discovery, monitoring, and alerting as a wrapper around the service.
Most of the time, the service itself does not expose any metrics, so it’s up to us to identify if there is a tool that can be used to expose these metrics to the world. In our example, there are third-party tools that allow us to monitor PostgreSQL and Tomcat, whereas we can enable service discovery by using our automation scripts directly.
In this case, the telemetry that is exposed to the world is related to generic service details such as:
- Thread pool metrics
- Session metrics
- Request processor metrics
- Database connection pool metrics
- Tomcat version info
- Servlet response time metrics
- Database response time metrics
These metrics are specific to the Tomcat instance and the database engine and not to the various web applications that may be using them.
Application Layer
In the previous major automation layers, we were mostly automating deployments and configuration of third-party tools. The various tools we needed were pre-compiled by development teams and placed on binary repos for our convenience.
This is not the case for the application layer. Usually, in this layer, we are the developers of the web application and, in addition to deployment automation that we had to support in the previous layers, we also need to automate a number of other tasks.
We need to automate:
- Building the web app
- Releasing the web app
- Testing the web app
Relationship between Build - Test - Deploy automation layers
The build, test, release, and deploy layers are the basic building blocks of what we call a continuous integration and continuous deployment/delivery pipeline (CI/CD pipeline).
Each one of these layers has enough depth to guarantee its own presentation, so we will only present the various options we have at a very high level here.
Automating the CI/CD pipeline is one of the first things an organization interested in adopting DevOps practices usually does.
There are various automation options for each one of these phases and, in overseeing the full pipeline and connecting its various components, we usually find a category of tools called Application Release Automation (ARA).
ARA tools come in a variety of flavors. We have ARA tools that are simple orchestrators of the CI/CD pipeline and do not do much beyond that, and ARA tools that collect metrics, allow for automated gates based on the metrics collected, allow for manual decision points, support AI that allows them to capture weak failure signals that are not detected by our automated testing suites, provide metrics dashboards, and audit logs of all the execution history of our pipeline.
In the next few sections, we will describe each one of these automation layers individually.
Build job automation
There are multiple tools that can be used to create build jobs. In this example, we will refer to Jenkins.
Jenkins supports two ways of automating build job creation: the Jenkins DSL plugin and the Jenkins Pipeline plugin. Both are Groovy-based DSLs, but their architectures differ.
Jenkins DSL-based jobs rely on a main seed job, which acts as the parent job of all other Jenkins DSL-based jobs.
Jenkins Pipeline-based jobs are decentralized and do not depend on a common parent.
Apart from the differences in architecture, there is one more important difference between the two build job automation methods. When people use Jenkinsfile, the file becomes part of the project and is versioned alongside the project.
A team could, of course, decouple the Jenkinsfile from the project, and there are some deployment pipelines that exist in isolation, but the majority of Jenkinsfiles are versioned alongside the code they build.
Some people think that Jenkins Pipeline jobs are a rival technology to Jenkins DSL jobs, but they will probably be surprised to find out that Jenkins DSL has native support for build jobs that are created using Jenkinsfiles. One could use a Jenkins DSL job to create the stub that is needed for Jenkins to create a Jenkinsfile build job.
In both cases, there is an important shift in how we manage our build jobs. We move from something that is tied to a web interface and cannot be automated or tested to a definition of a build job as code that can be automated, versioned, and tested like any other piece of code.
Test automation
Test automation is usually embedded in the build and deployment pipelines. There are many frameworks that can be used to automate testing.
I am not going to cover test automation here; that is a topic that can be explored in its own book, or books.
I will only mention briefly unit/integration/system/end-to-end testing as the main types of tests that will exist in the majority of the pipelines and JUnit, Cucumber, Selenium as technologies that can be used to automate them.
Deployment automation
Deployment automation is needed for almost all testing phases. In order to test our application in most scenarios—the exception being the unit testing phase—we need to deploy it to an environment. In this case, we assume that the Tomcat service has already been deployed and configured in the service layer, so the only thing remaining for us to do is to deploy and configure our app.
The deployment of our app will be different depending on the environment and the architecture. Its configuration will also change; there will be different DB connection URLs to PostgreSQL and possibly different memory settings depending on the architecture and the expected load. As we go from development deployments to production-like deployments, our configuration will increasingly become more production-like in an effort to test on an environment that is as close to production as possible.
Similar to the service automation layer, we can use a number of different technologies to automate our deployment. We can use the same tools we used for the previous phases (Chef, Salt, or Puppet) or tools that were specifically designed for application deployments, such as XL Deploy.
Service discovery automation
When we are developing our own applications, it makes sense to enable service discovery and telemetry. There is no restriction to what information we can expose. We can expose the bare minimum that will allow us to verify the health of the service.
Alternatively, we can use service discovery and monitoring in a way that will not only allow us to monitor and alert on the health of the system, but also allow for A/B testing, customer segmentation, use of feature flags, and provide detailed usage reports of all these experimental features to the developer team and their management.
Service discovery and state exposure can be used by our services as our common integration point, allowing us to increase resilience and implement automated disaster recovery.
Monitoring and alerting automation
Monitoring and alerting automation in this layer can be combined with service discovery automation. There are tools, such as Prometheus, that can scrape a service discovery service, such as Consul, and determine if there are any services there that act as a Prometheus exporter. Modifying our application to register itself to a Consul cluster and then to expose its own internal state in a Prometheus-compatible way is very simple.
Prometheus will be able to scrape any metrics exposed as a simple list of key/value pairs.
The type of metrics that we are expecting to harvest from this layer of monitoring are application-specific and should expose the internal state of the system. Active user sessions, memory state, number of DB connections, open files, etc., are all relevant to the application and can be used to determine if the application is functioning within the expected parameters.
If this type of monitoring is available to all phases of the software development lifecycle, we will have enough information from the previous testing phases (e.g., performance testing) to allow us to detect when the service is about to fail (e.g., if it is under extreme load) and act before that happens.
Conclusion
There is an upfront investment in automation that prevents some people from adopting it in their projects. Automation has infrastructure, implementation, and training costs associated with it. However, the benefits of automation can by far exceed its costs.
Adopting automation does not mean we have to implement all the layers that were presented in this article at once. We can follow a step-by-step approach. As we go forward implementing the various layers of automation, the value from each layer will be delivered to the team and the customer, and increase the support and momentum in the automation initiative.
Automation allows us to scale up or down as needed, deliver a better quality of service by embedding QA in the CI/CD pipeline, detect failure signals as early as possible, and fix them before they end up in the live environment and become costly production incidents.
In addition, automation in monitoring and alerting allows us to get valuable insight into the behavior of our services and our client base, and that in turn allows us to predict future trends. These trends may be in client behavior that can be used to detect new opportunities, or in resource utilization that can be used to create realistic resource projections that allow us to maintain high quality in our service.