DIY home automation
Table of contents
- Introduction
- The ISM Radio Bands
- Decoding the Gadgets
- Using the data
- Eye Candy
- Potential Issues
- Conclusion
- References
Introduction
Smart homes, or home automation as a concept, have existed for a few decades now. The final result of the evolution of this market is that we have ended up with a patchwork of devices and protocols that may or may not talk to each other.
We have competing ecosystems, and you can find devices that use technologies such as Zigbee or Z‑Wave to talk to each other, but these two networks are incompatible with each other.
In addition to that, we may have devices that use proprietary protocols that we cannot use or control unless we buy into their ecosystem.
In this article I will present a DIY approach to how we can interact with these devices.
I will focus on devices using ISM radio bands (433 MHz, Zigbee). The same approach could be used for other home automation technologies as long as they are open and not proprietary.
The ISM Radio Bands
Many devices use what is called ISM radio bands for their communication, and within those bands they use specific protocols to talk to each other. According to Wikipedia:
The ISM radio bands are portions of the radio spectrum reserved internationally for industrial, scientific and medical (ISM) purposes, excluding applications in telecommunications.
and
Cordless phones, Bluetooth devices, near-field communication (NFC) devices, garage door openers, baby monitors, and wireless computer networks (Wi-Fi) may all use the ISM frequencies, although these low-power transmitters are not considered to be ISM devices.
These devices are going to be the focus of this article.
433 MHz Band
433 MHz is one of the bands reserved for ISM applications. But as we will see, it is also used for domestic applications and it is a very convenient way to expand your home automation if you are DIY-inclined and a bit handy with a soldering iron.
This band is a favourite with many manufacturers, hobbyists, engineers and IoT enthusiasts because it hits the sweet spot between range, signal penetration, power consumption and cost. It also does not require a licence for the manufacturer in most countries or is part of the ISM bands in others.
There are a huge number of devices that use this band, from temperature and humidity sensors, lighting, switches, remote controls—you name it. Apart from the off-the-shelf appliances that use this band, there are RF modules both for reception and for transmission that can be purchased for use in DIY projects.
Any Arduino enthusiast can acquire a couple of these modules and the sensor of their preference and build their own standalone, wireless-enabled appliance.
We can see one of these transceivers in the screenshot below.
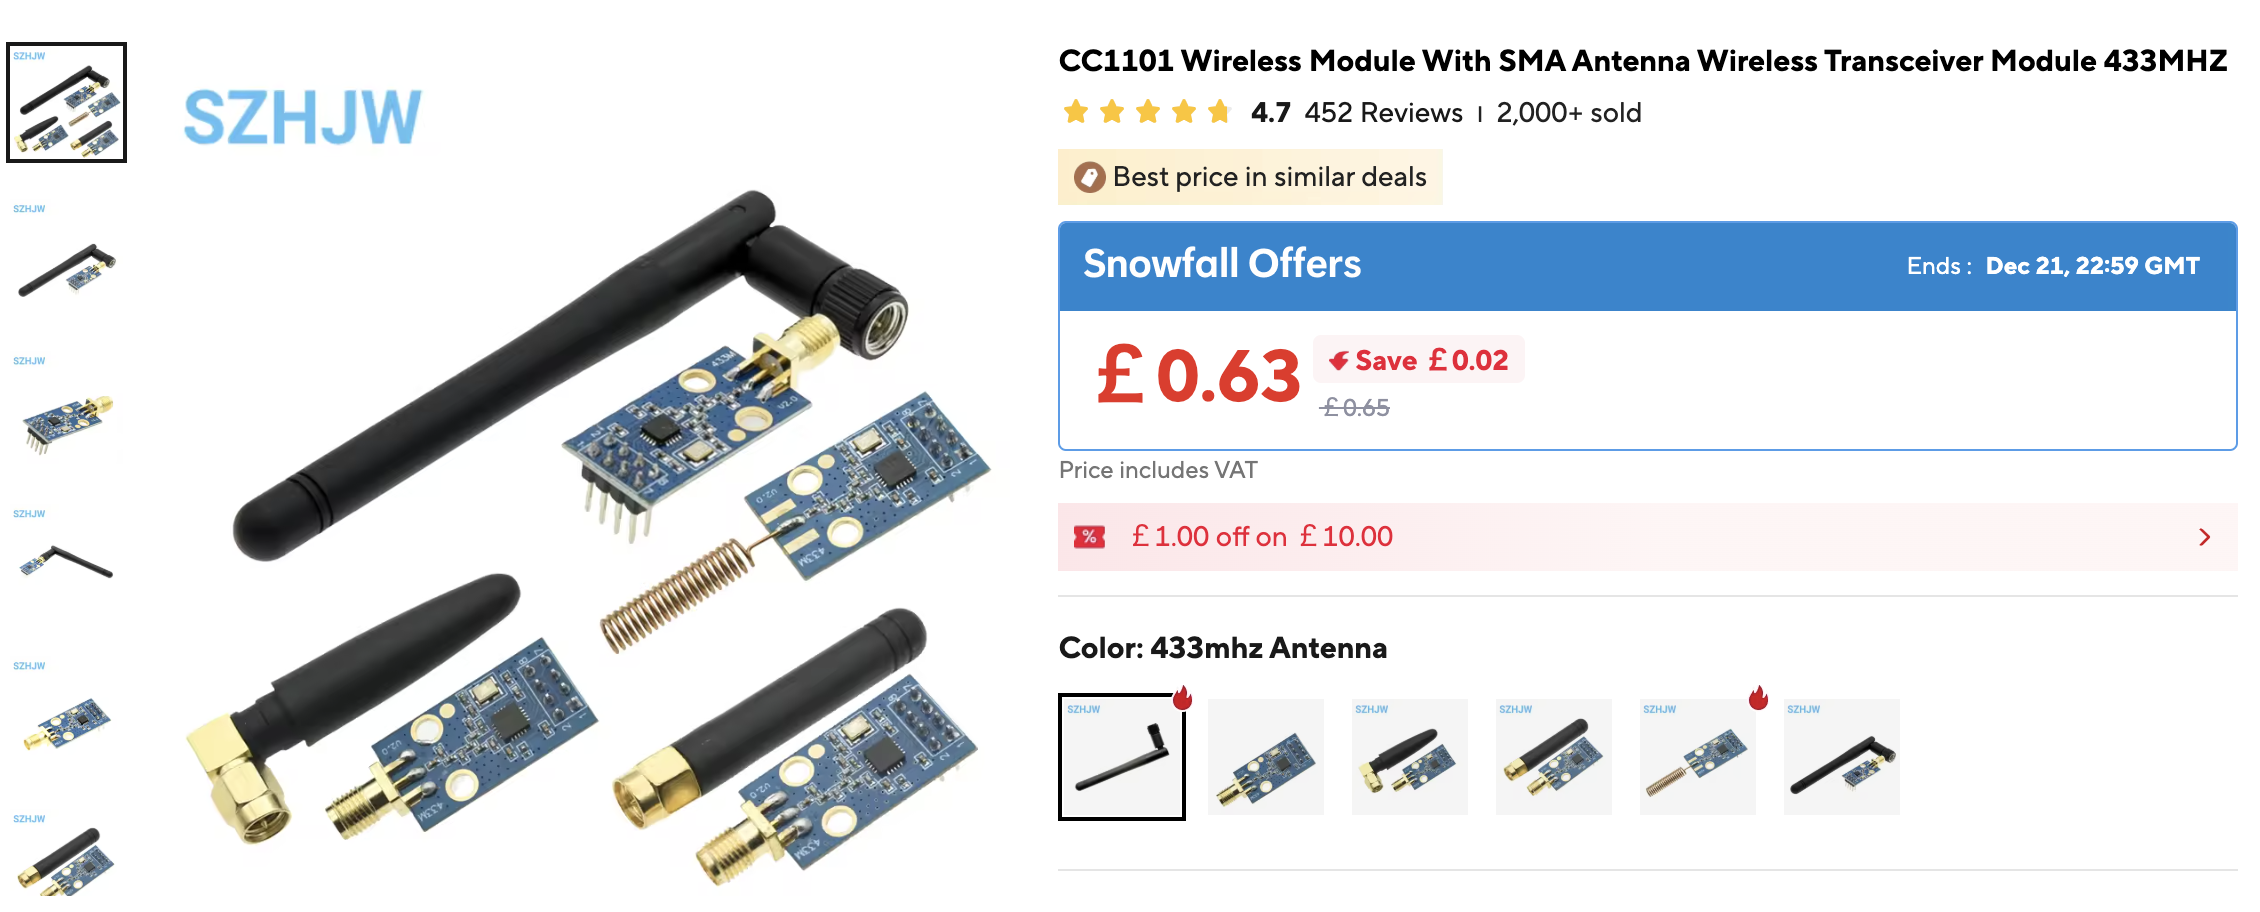
This is in fact what led me down this road in the first place. I wanted to create a custom light detector in order to monitor the hours of sunshine at home. I wanted to use this to understand if there was any point in me installing solar panels.
Eventually I did not build this particular sensor because I found the data I was looking for from a friend who already has solar panels, but in the meantime I had built the architecture I am going to present already.
There are Arduino libraries that can easily allow us to encode and decode data using the 433 MHz band, such as RF433any and DIY articles with step-by-step instructions on how to use them.
Zigbee
Zigbee is a more modern, more powerful and more complicated technology than the ones used in the 433 MHz band. It also uses some of the ISM bands; the exact frequencies used vary from country to country.
From Wikipedia:
Zigbee is a low-power wireless mesh network standard delivering low-latency communication, and targeted at battery-powered devices in wireless control and monitoring applications. Zigbee chips are typically integrated with radios and with microcontrollers.
and
Zigbee operates in the industrial, scientific and medical (ISM) radio bands, with the 2.4 GHz band being primarily used for lighting and home automation devices in most jurisdictions worldwide.
It allows for more complicated methods of communication, a mesh network, higher transfer rates than the 433 MHz band and encryption.
It supports star, tree and mesh network topologies. Every network must have one coordinator device.
On the DIY side of things, Zigbee support exists for ESP boards.
Zigbee transceivers can be acquired in a similar manner to 433 MHz modules, although as we can see they are about 693% more expensive.
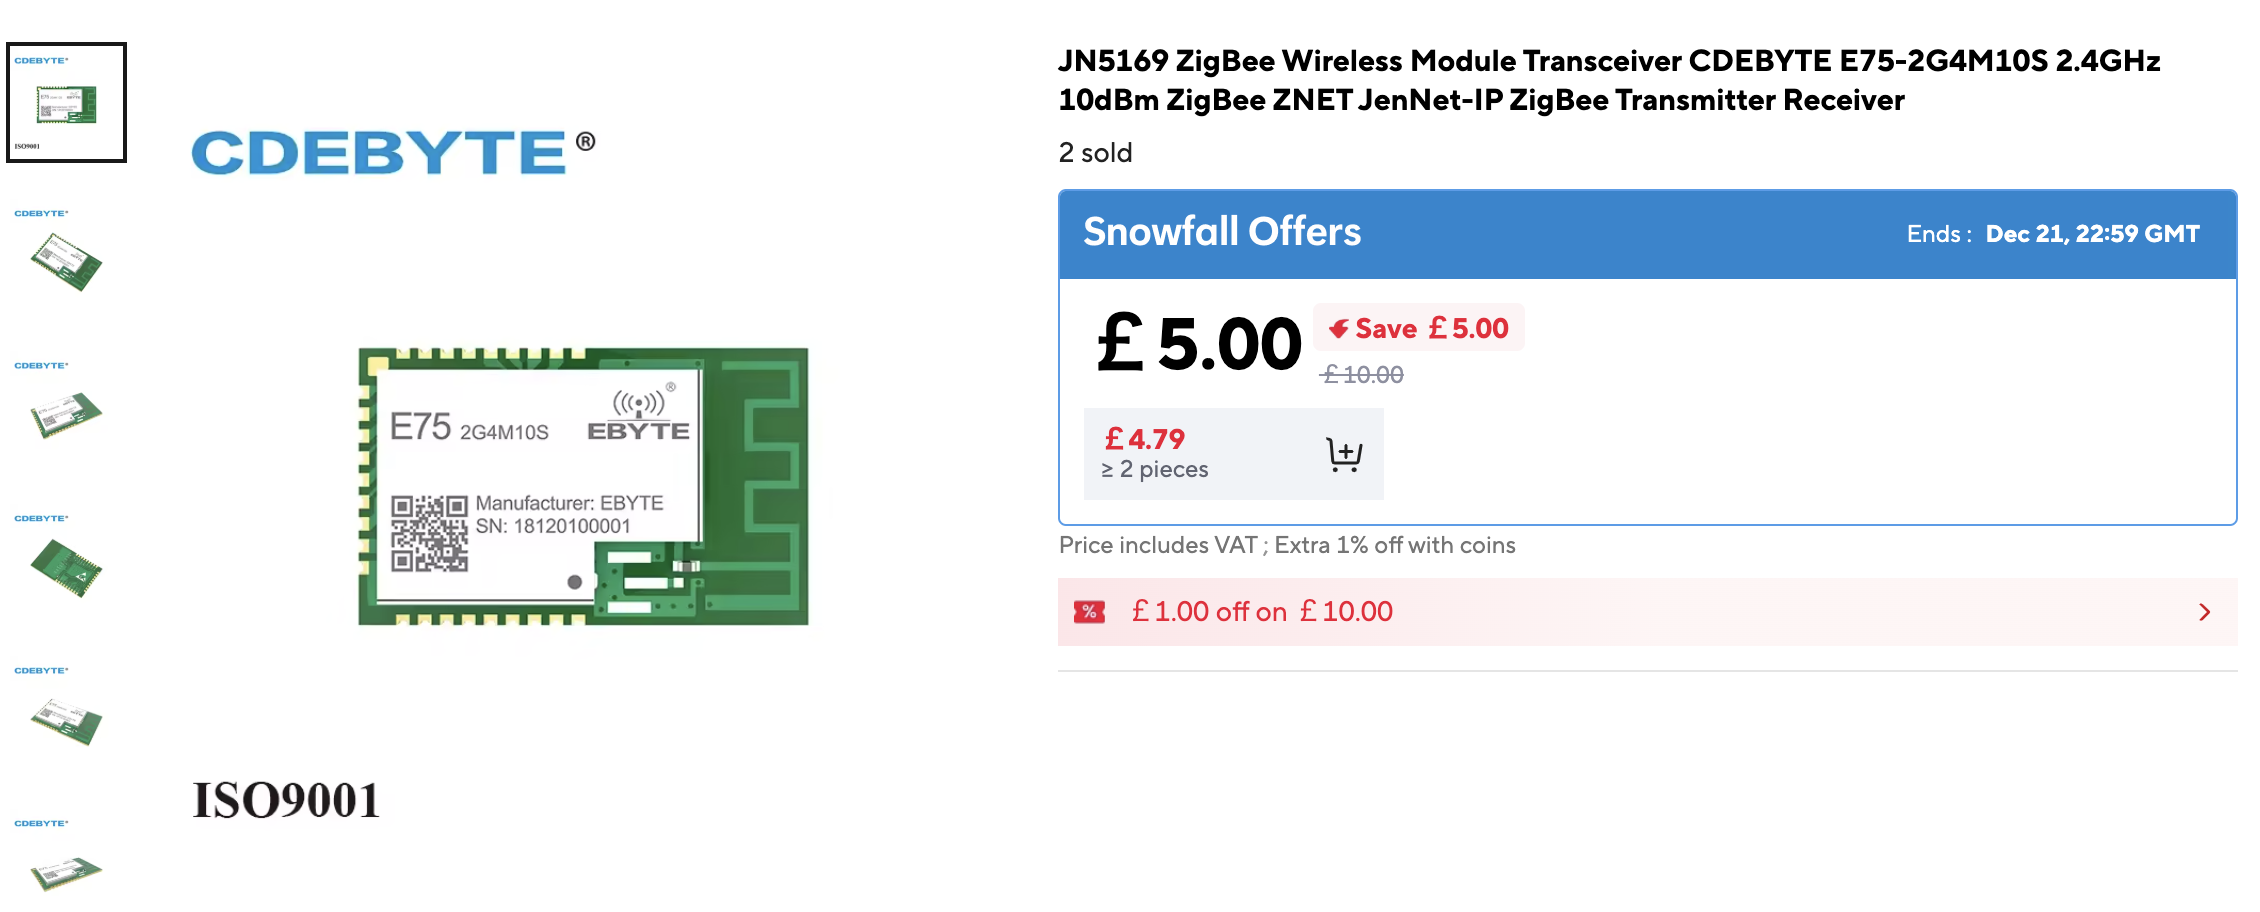
There is extensive support for Zigbee in the IoT and home automation market, so it may very well be that you already have Zigbee devices and you don’t know it.
Decoding the Gadgets
In this article we will not focus on how to build your own Zigbee or 433 MHz-enabled devices, but we will assume that you have already acquired a few of them even though it is quite possible you did not do it intentionally. Maybe you got a couple of weather stations or a smart switch.
This article will present a method of tapping into the network of your existing smart appliances and getting a copy of the data for yourself.
I will present two topologies that will allow you to monitor the data as well as enrich and transform data coming from multiple devices.
An extension of these topologies could potentially allow you to control your home automation.
We will cover both technologies but will provide examples only for the 433 MHz band.
Reading the Signals
At this point we have established that you have signals flying over your head that are either transmitted at the 433 MHz band or alternatively use the Zigbee technology.
You may wonder if it would be possible in some way to intercept and decode that traffic.
As it happens, this is indeed possible. It can be done by using a receiver connected to some kind of computer that will be able to decode whatever traffic exists. There are specialised receivers for this kind of thing, or alternatively you can use a wideband receiver such as RTL-SDR for both.
One word of warning: if you want to decode Zigbee signals at the 2.4 GHz band you will need some additional hardware as mentioned here. RTL-SDR maximum frequency is less than 2.4 GHz.
This makes it ideal for a number of applications. You can use the same device to decode ADS-B signals for aeroplane traffic, listen to radio, decode terrestrial over-the-air TV, decode sub-1 GHz Zigbee signals or decode the 433 MHz band.
RTL-SDR is not considered to be a particularly good receiver. It is wide open to a big range of frequencies, and as such sensitive to interference.
So if you wanted to use it to watch TV, for example, you could find a lot better receivers.
On the other hand, for the purpose of all-in-one receivers for a small amount of money it is indeed value for money. We can see one of those RTL-SDRs in the following screenshot.
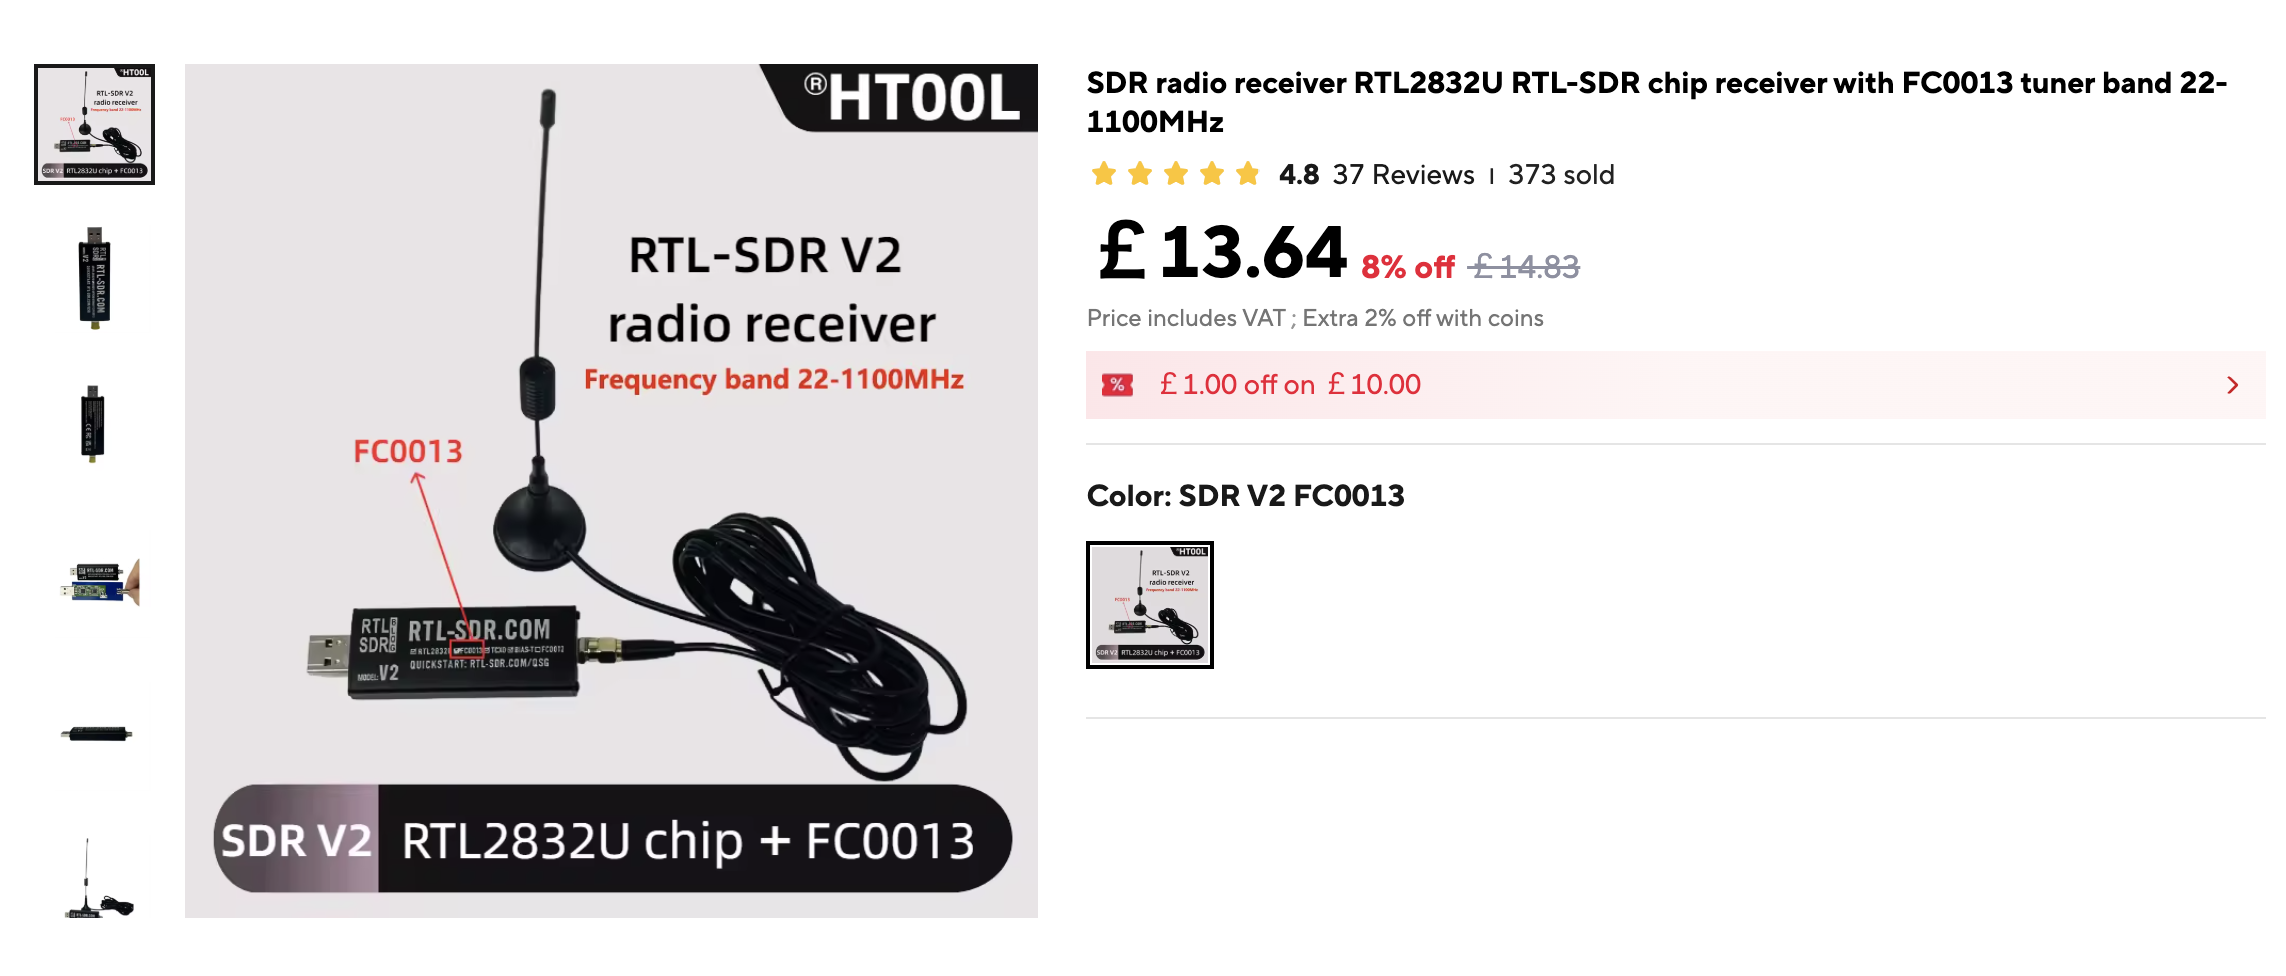
After acquiring the SDR, all we need is a computer to decode it. A Raspberry Pi 3 is powerful enough for this. All we need to do is connect our dongle to the Pi, install the appropriate software and off we go.
Decoding Zigbee
To decode Zigbee signals, we can use a tool such as sdr4iot-zigbee-rx. This tool allows us to capture and decode the signals for further processing.
Decoding 433 MHz
To decode 433 MHz band signals, we can use a tool such as rtl_433. rtl_433 can decode signals from multiple bands, not just 433 MHz, and supports a wide range of protocols and devices.
This is the tool I have the most experience with and actively use in my setup.
When executed manually, we see something like the following screenshot:
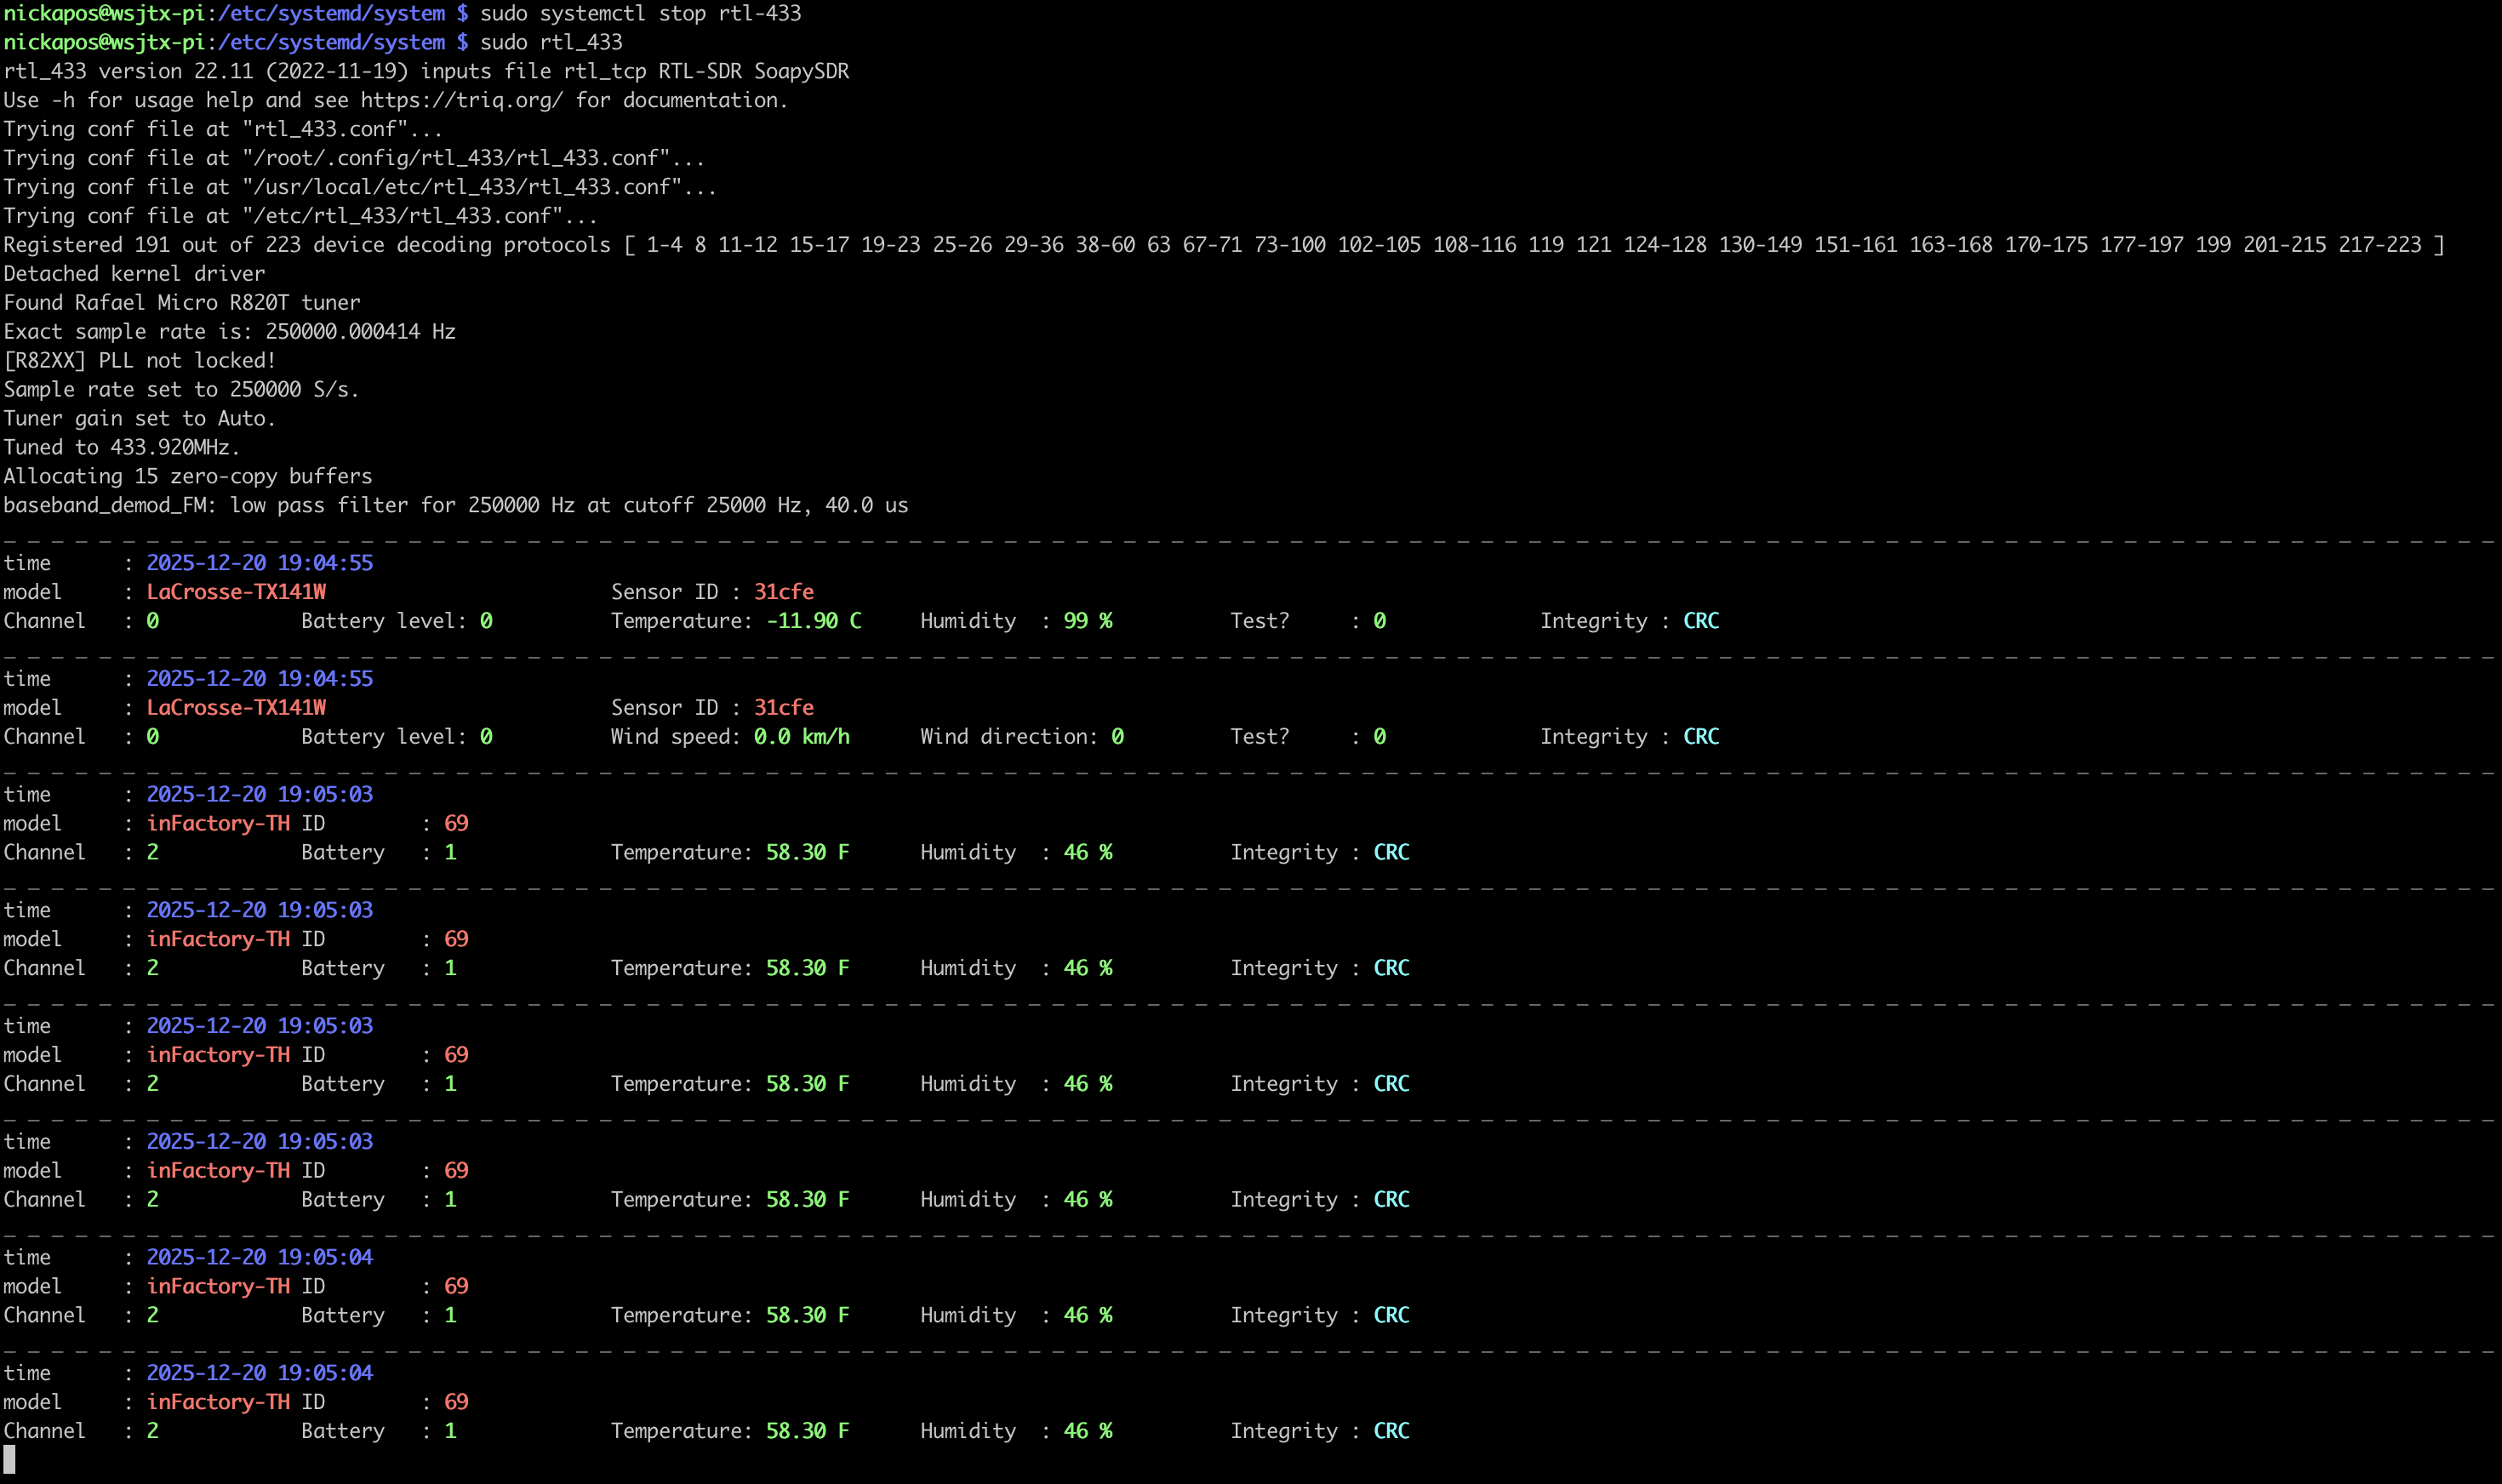
The output shows how many signal types the tool can decode and begins decoding them automatically.
It reports the various sensors and data it receives in real time. This is useful when verifying that the setup works as expected, but we cannot do much post-processing while the data remain in this raw form.
MQTT
rtl_433 can decode signals and write them to stdout, a file, or alternatively forward them to an MQTT server.
MQTT is the go-to standard publish/subscribe (pub/sub) machine-to-machine IoT message broker. It follows a publisher/subscriber architecture — in this case, the publisher is the rtl_433 decoder.
It submits its data under specific topics for each sensor, which can then be consumed by another tool for further processing.
One of the most popular MQTT brokers is called Mosquitto. It is lightweight and can be set up either on the same Raspberry Pi that performs signal decoding or on another system used for general monitoring.
Either way, the rtl_433 process can be configured to publish its data to Mosquitto with a command similar to:
/usr/bin/rtl_433 -vv -F mqtt://127.0.0.1:1883
which will produce output similar to the following:
Dec 14 16:42:30 wsjtx-pi rtl_433[25671]: rtl_433 version 22.11 (2022-11-19) inputs file rtl_tcp RTL-SDR SoapySDR
Dec 14 16:42:30 wsjtx-pi rtl_433[25671]: Use -h for usage help and see https://triq.org/ for documentation.
Dec 14 16:42:30 wsjtx-pi rtl_433[25671]: Trying conf file at "rtl_433.conf"...
Dec 14 16:42:30 wsjtx-pi rtl_433[25671]: Trying conf file at "(null)/.config/rtl_433/rtl_433.conf"...
Dec 14 16:42:30 wsjtx-pi rtl_433[25671]: Trying conf file at "/usr/local/etc/rtl_433/rtl_433.conf"...
Dec 14 16:42:30 wsjtx-pi rtl_433[25671]: Trying conf file at "/etc/rtl_433/rtl_433.conf"...
Dec 14 16:42:30 wsjtx-pi rtl_433[25671]: Publishing MQTT data to 127.0.0.1 port 1883
Dec 14 16:42:30 wsjtx-pi rtl_433[25671]: Publishing device info to MQTT topic "rtl_433/wsjtx-pi/devices[/type][/model][/subtype][/channel][/id]".
Dec 14 16:42:30 wsjtx-pi rtl_433[25671]: Publishing events info to MQTT topic "rtl_433/wsjtx-pi/events".
Dec 14 16:42:30 wsjtx-pi rtl_433[25671]: Publishing states info to MQTT topic "rtl_433/wsjtx-pi/states".
Dec 14 16:42:30 wsjtx-pi rtl_433[25671]: Registering protocol [1] "Silvercrest Remote Control"
Dec 14 16:42:30 wsjtx-pi rtl_433[25671]: Registering protocol [2] "Rubicson, TFA 30.3197 or InFactory PT-310 Temperature Sensor"
Dec 14 16:42:30 wsjtx-pi rtl_433[25671]: Registering protocol [3] "Prologue, FreeTec NC-7104, NC-7159-675 Temperature Sensor"
Dec 14 16:42:30 wsjtx-pi rtl_433[25671]: Registering protocol [4] "Waveman Switch Transmitter"
Dec 14 16:42:30 wsjtx-pi rtl_433[25671]: Registering protocol [8] "LaCrosse TX Temperature / Humidity Sensor"
Dec 14 16:42:30 wsjtx-pi rtl_433[25671]: Registering protocol [11] "Acurite 609TXC Temperature and Humidity Sensor"
Dec 14 16:42:30 wsjtx-pi rtl_433[25671]: Registering protocol [12] "Oregon Scientific Weather Sensor"
As shown, rtl_433 publishes its decoded data to MQTT, indicating which topic structure it follows and which protocols it supports.
Using the data
The next step is to decide what to do with the data. In my case, I just wanted to visualize the data, but at this point, you could do much more. I’m going to present two alternative architectures that will allow you to do this.
One is simpler than the other. The more complex architecture allows data enrichment, transformation, and the addition of logic that can trigger specific actions.
I previously used the more complex architecture, which supported data transformation, but due to a hardware failure, I chose the simpler approach the second time around.
Architecture 1
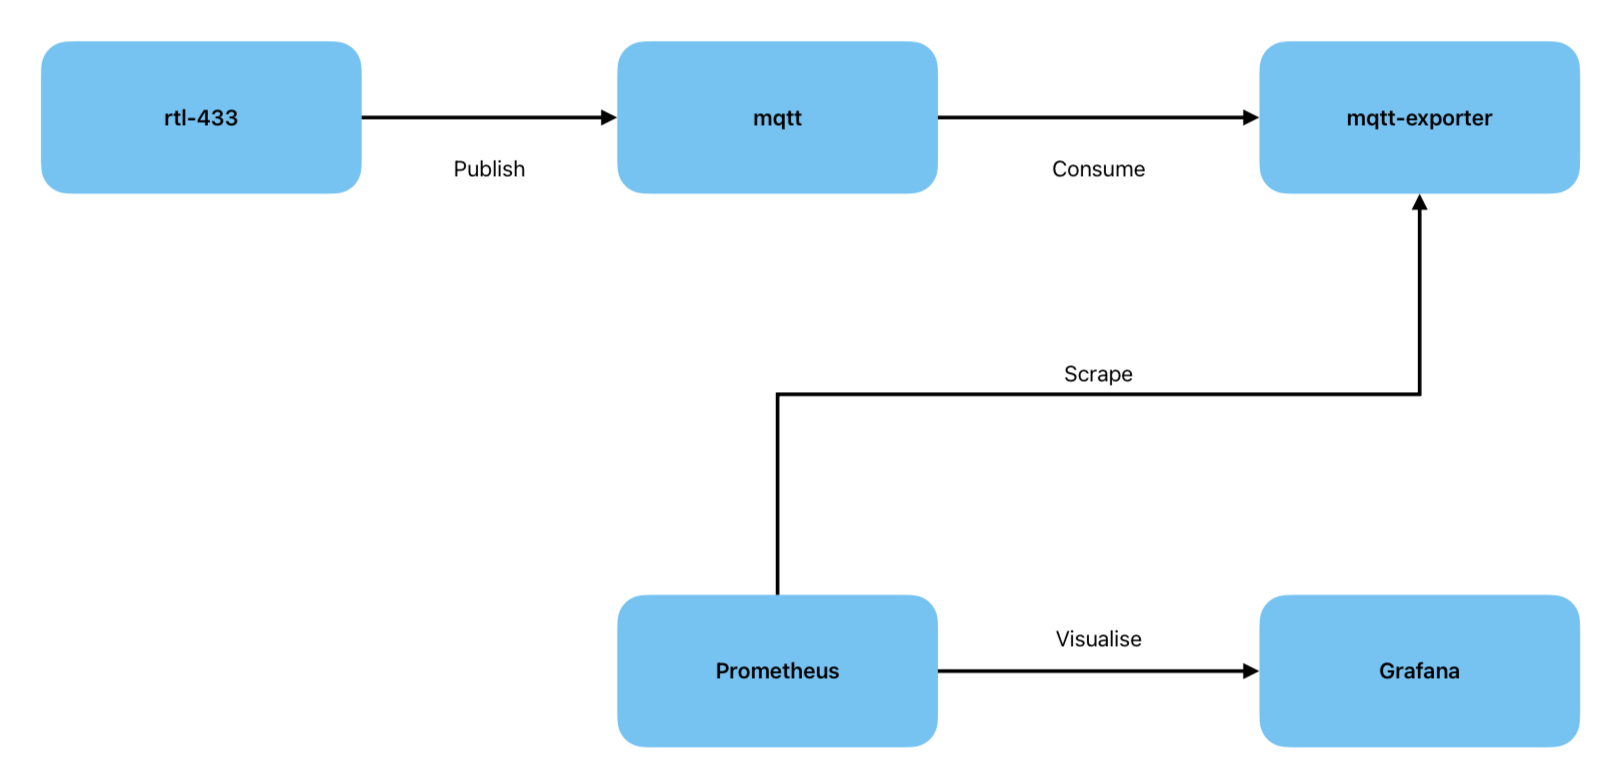
The first architecture uses a Prometheus MQTT exporter to read data from MQTT and expose it for scraping by Prometheus. Then Grafana can connect to Prometheus for data visualization.
This is the simplest possible architecture with the fewest moving parts, but it does not allow for data transformation or enrichment. If your data does not conform to the desired format, there isn’t much you can do without adding additional components.
All this is shown in the following diagram:
Architecture 2
A more powerful architecture that uses a different approach is shown in the following diagram:
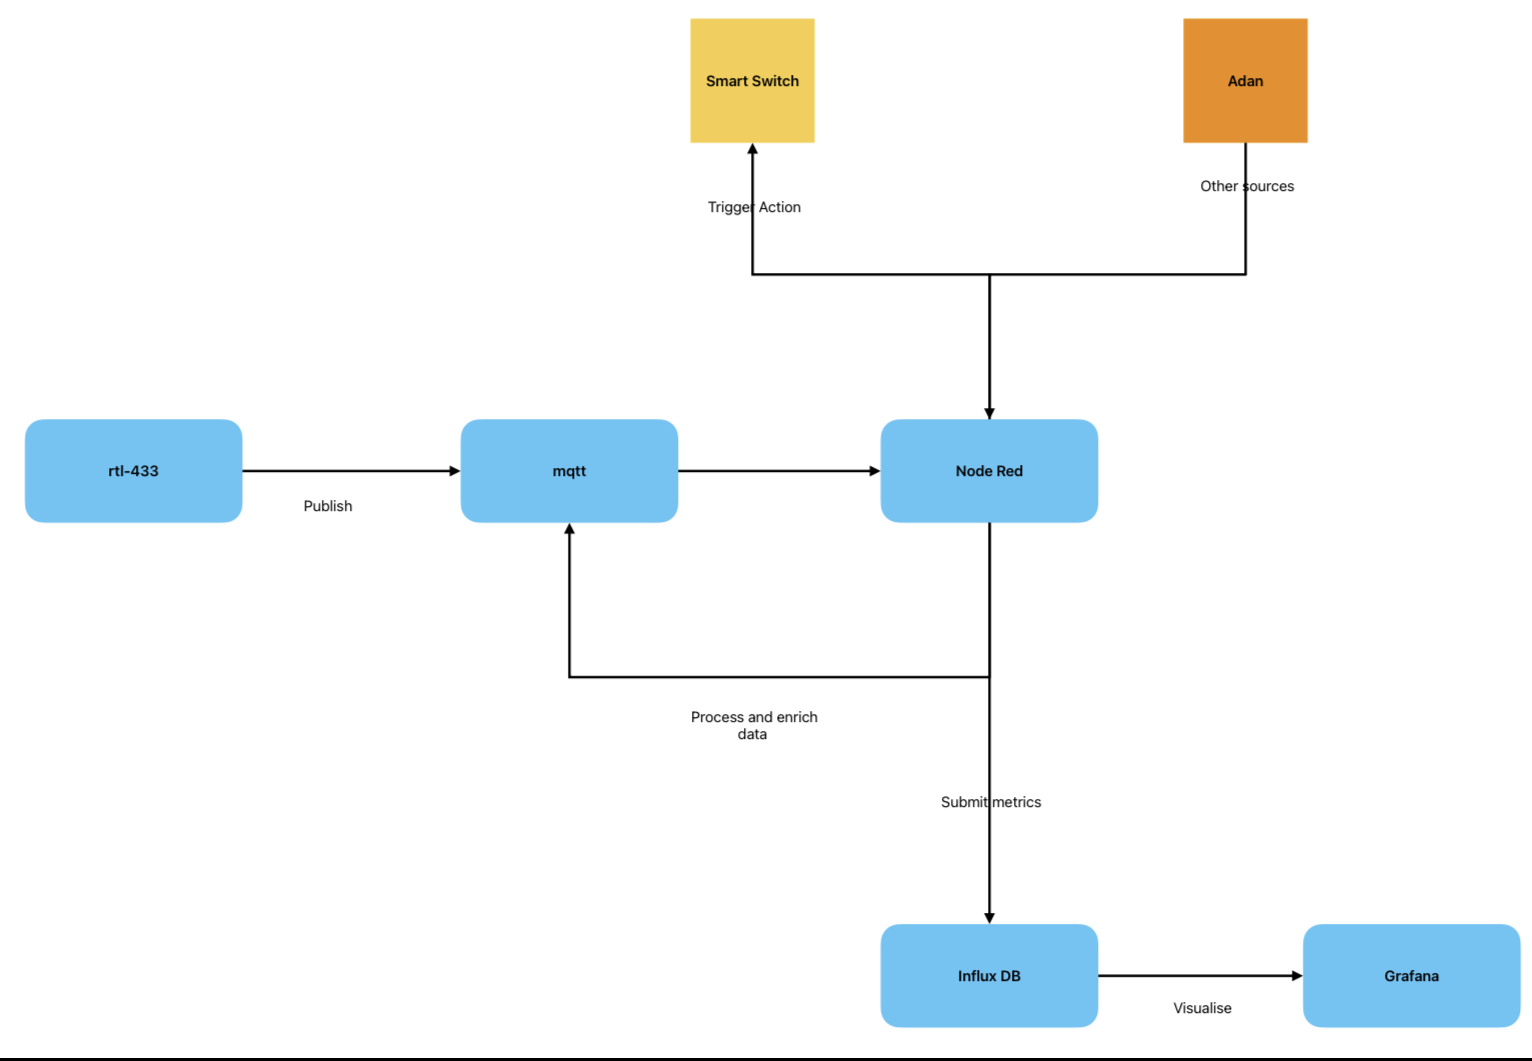
In this case, we are not using Prometheus. Instead, we use InfluxDB. InfluxDB has a push architecture, whereas Prometheus uses a pull architecture. This means that Prometheus expects to read values from an exporter, while InfluxDB expects an agent to push data to it.
In this setup, the service acting as the InfluxDB agent is Node-RED.
Node-RED is a powerful low-code, event-driven middleware platform that can be used to create event-driven workflows. It can collect, transform, and visualize data, as well as drive devices by sending events to them.
In this particular case, Node-RED reads sensor data from MQTT, transforms it, and submits it to InfluxDB. Grafana then reads the data from InfluxDB for visualization.
This architecture is more capable than the previous one because Node-RED can read data from multiple sources, transform it, and even publish it back to MQTT for further processing. In the past, I used this approach to process data from my ZigBee-based smart meter and my ADS-B receiver, which does not support MQTT or InfluxDB by default but provides an API that can be queried.
Eventually, all data were visualized in Grafana.
In addition, Node-RED can be extended with the smart-nodes library to control smart devices and create more complex workflows based on incoming data—beyond simple visualization—but that is outside the scope of this document.
Eye Candy
After all of this, you can visualize your data like so:
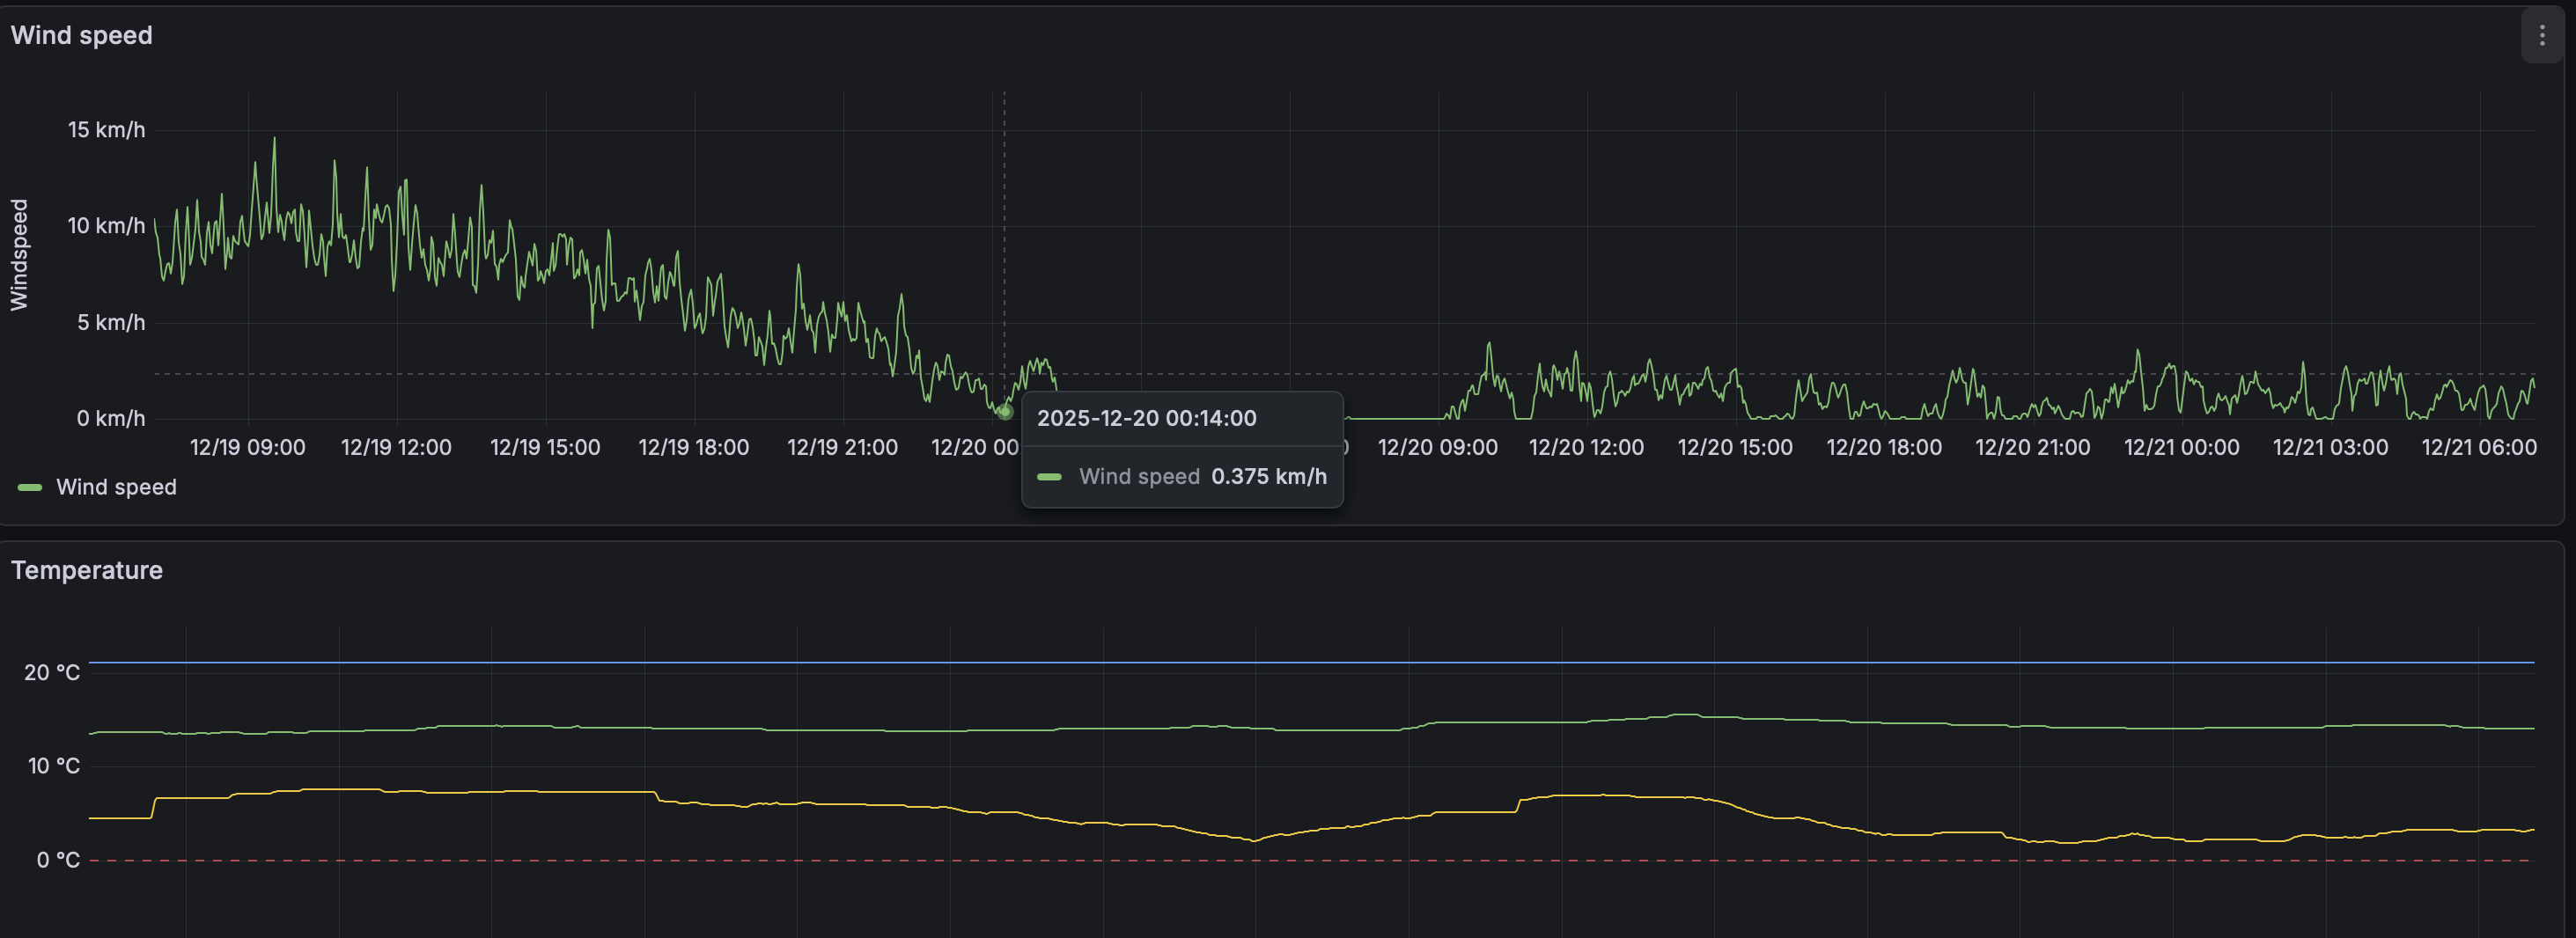
Of course, you can define thresholds and create alerts when certain conditions occur — for example, if the temperature falls below a set threshold — and if you are using the Node-RED architecture, you can trigger actions such as turning on the heating.
There’s no limit to what you can do.
Potential Issues
From time to time, you might encounter some issues. For example, there’s always the chance of a sensor failure or a sensor going haywire. These sensors are factory-calibrated, but you still need to keep an eye out for misbehavior — especially if you’re triggering actions based on their input.
In addition, you may experience interference from other sources — either from nearby sensors running on the same frequency or from other equipment operating in the same range. It’s quite likely that your rtl_433 decoder will pick up signals that don’t belong to you.
We can see this happening here:
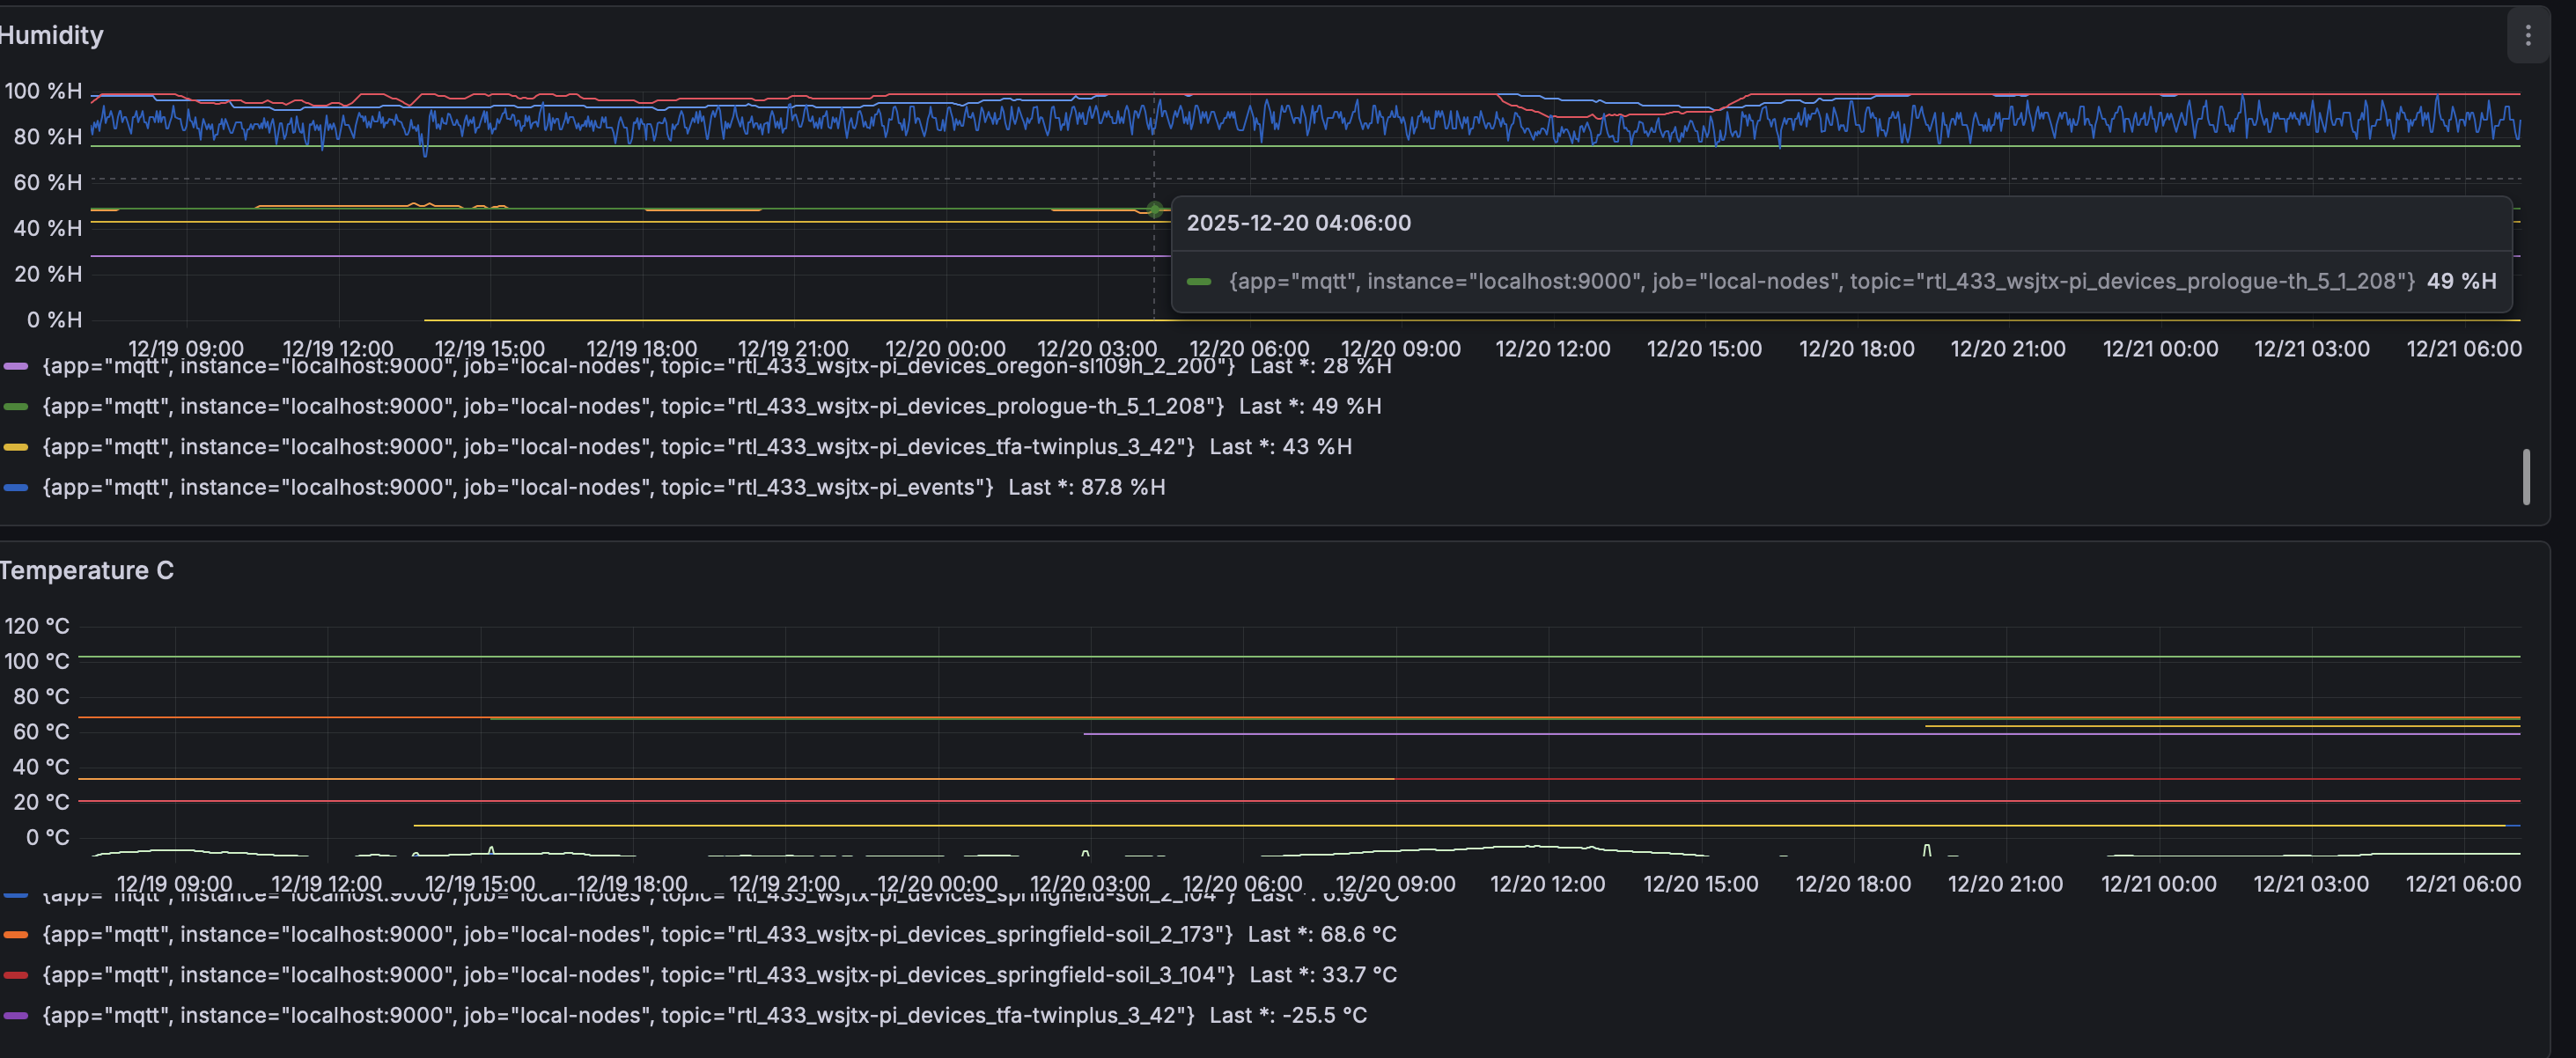
In this graph, we can see an unfiltered view of all the sensors my RTL decoder detects. Most of these aren’t mine — I don’t own a soil sensor, and I’m not entirely certain what this “TwinPlus” sensor reporting -25 °C is.
Maybe someone in the neighborhood has a smart freezer?
Conclusion
The techniques presented in this article allow us to build our own DIY home automation systems and potentially re‑purpose and extend off‑the‑shelf commercial solutions in ways that go beyond their original design.
They empower us to take control of products and services that might otherwise be opaque and to understand exactly what is happening in our home environment.
As always, with power comes responsibility — it’s important to be considerate and respect other people’s privacy.
So act responsibly, and have fun with your home automation!
References
- https://en.wikipedia.org/wiki/ISM_radio_band
- https://en.wikipedia.org/wiki/Zigbee
- https://thinkrobotics.com/blogs/learn/433-mhz-rf-module-communication-basics-a-complete-guide
- https://www.onesdr.com/433-mhz-band/
- https://docs.arduino.cc/libraries/rf433any/
- https://electronics-diy.com/complete-guide-for-rf-433mhz-transmitter-receiver-module-with-arduino.php
- https://docs.espressif.com/projects/arduino-esp32/en/latest/zigbee/zigbee.html
- RF433any
- sdr4iot-zigbee-rx
- rtl_433
- moquitto
- NodeRed
- smart-nodes library
- InfluxDB
- Prometheus
- Grafana