Layers of monitoring and logging
Table of contents
- Introduction
- Three Ways of DevOps Refresher
- Layers of Automation Refresher
- Multidimensionality of Monitoring
- Aligning the layers of automation with the layers of monitoring
- Logging
- Network monitoring
Introduction
A few months ago, I published an article about the various Layers of Automation we can find in a modern environment.
In reality, this article did not start its life a few months ago; it started several years ago, and I have presented it in various shapes and forms both internally in the various companies I have worked for and also at various events in order to highlight the hidden complexity of a modern tech stack.
There is something missing from this article—or, to be precise, not exactly missing but implied. As I have presented in another article, The Three Ways of DevOps, the second way is about feedback loops. It is really about monitoring and alerting.
So how could I ever present the various layers of automation without having a companion article about the various layers of monitoring?
In reality, these two concepts are closely related. In the same way I have presented the various layers of automation in the past in various forums and circumstances, I have also presented the various layers of monitoring, although I did not call them that.
Often I would present this concept using the “right tool for the job,” where I would explain why Tool A may be good for infrastructure monitoring but not necessarily ideal for application monitoring, which implies the existence of an infrastructure layer and an application layer.
This is the focus of this article, where we will continue the discussion from where it was left in the Layers of Automation article and expand it to cover the layers of monitoring.
Three Ways of DevOps Refresher
- The first way: Systems thinking. Promotes system-wide design and ultimately automation.
- The second way: Amplifying feedback loops. Introduces telemetry to all stages of the system.
- The third way: Continuous experimentation and improvement.
Layers of Automation Refresher
The Layers of Automation article is a consequence of the first way of DevOps. We need to think systemically.
This also applies to how SRE should be done. We should not be optimizing for our part of the system but for the whole system.
This means building horizontal collaborations across teams that include product, project management, security and trust, and infrastructure people.
When we think systemically, we can identify that modern services can be analyzed across multiple layers, and each layer needs its own automation.
We can see this represented in the following diagram.
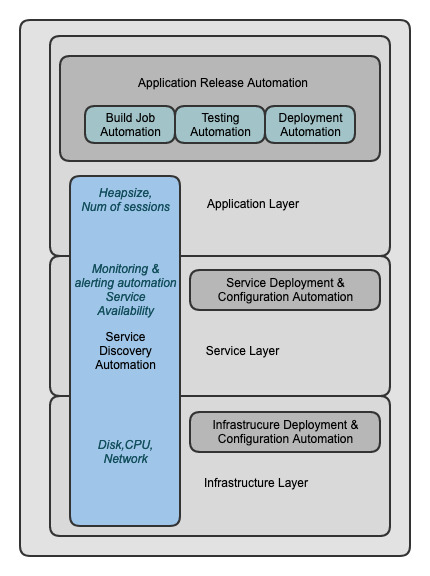
We can see that we can slice our infrastructure into major horizontal layers that may contain additional layers themselves.
This means that monitoring is a multidimensional space. We will come back to this later.
We also see that there are vertical layers that can span multiple horizontal layers, and in this I have included monitoring and alerting automation.
The vertical layers represent common needs that span all horizontal layers, such as monitoring and service discovery.
This means that there is a need for these things (monitoring and service discovery) for each and every one of the horizontal layers.
The major horizontal layers we can identify are:
- Infrastructure layer (e.g., creating a virtual machine or a virtual private cloud, a kubernetes cluster, networking1)
- OS layer (e.g., a Linux VM)
- Service layer (e.g., a database, a Docker engine, a Tomcat server)
- Application layer (e.g., the actual service deployed in the Docker engine or Tomcat)
We can see that some of these layers can be broken down into additional layers. For example, a Kubernetes cluster has itself multiple layers—again an example of multidimensionality.
- ↩ Networking is a very special case; we will come back to this as well.
Multidimensionality of Monitoring
Before we move on to the alignment of automation and monitoring layers, let’s discuss briefly the concept of multidimensionality, since it will be needed later in the article to define relationships between layers.
According to Wikipedia, the dimension of a mathematical space (or object) is informally defined as the minimum number of coordinates needed to specify any point within it.
Another useful concept here is the definition of a hypercube. In its most simple form, a hypercube is a cube that contains nested cubes.
In this case, we have an n-dimensional cube, and we need n coordinates to specify properly any point within it.
The reason why this is important is that this concept is analogous to object composability and encapsulation in software engineering.
This means that we can treat objects within objects as hypercubes and use the coordinates concept to navigate this hierarchy.
A good example of this is an LDAP traverse path such as CN=John Doe,OU=Sales,DC=example,DC=com, where we need 4 dimensions in order to reach the John Doe object.
The same thing can be done with programming language packages, where in sales com.example.sales.UserManager, the class UserManager can be reached using 4 dimensions.
This is useful when we are designing the architecture of a service, but it is also very useful when we want to analyze the architecture of this service for monitoring purposes. Our monitoring effectively needs to match closely the design of the service.
This is the reason why seemingly simple questions such as “Is this service healthy?” often do not have a simple answer.
In order to answer this question, we need to take into account both the external dependencies of the service and the internal dimensions of the service.
Aligning the layers of automation with the layers of monitoring
After explaining the multidimensionality of monitoring we are ready to discuss about the alignment between layers of automation and monitoring.
Monitoring the automation layers
It goes without saying that we need monitoring for the automation itself. This comes from the second way of DevOps. We need to know what our automation is doing; if we have observability without monitoring, then we are in for a world of pain.
When things go wrong with automated systems, we usually experience disruption on a massive scale, because automation allows us to make changes at massive scale. Therefore, we need robust testing, monitoring, and alerting systems in place to catch any issues early.
This means that we need to have at least one layer of monitoring for each layer of automation.
For each of these layers, we have one dimension — time — and then, depending on which layer we are talking about, several other secondary dimensions.
We can arrange these dimensions in different ways. For example, at the infrastructure layer, if we have a fleet of virtual machines, we can represent these in several ways. Here are two examples:
- As a fleet of systems, where the hierarchy is
region -> cluster -> system -> metric, which we can then expand to reach an individual machine (please note the analogy with an LDAP traversal path). - As a collection of metrics that have the system properties encoded as labels. For example, in Prometheus we have
node_load15{region="us-east-1",vpc="vpc-12345678",instance="node1.example.com:9100",job="node-exporter"} 0.27.
We need four dimensions plus time to reach the metric for this particular node. Again, please note the analogy with the LDAP traversal path. The multiple dimensions and the fact that Prometheus needs to keep a separate timeseries for each value of each label results to issues when we have high cardinality metrics and why we need to be extra careful to restructure our metrics to avoid this situation.
The difference is that in the first case, the root is the hierarchy of systems, whereas in the second example, the root is the metric, and we use the additional dimensions to locate the specific system we need.
Monitoring application layer
The application layer has all the complexities described in the previous section, but it also introduces some additional dimensions that do not usually exist when we are monitoring third-party infrastructure or services.
In these cases, we usually do not have first-party visibility into what is happening inside the service itself. For example, when using a managed database, we typically do not have full visibility into its internal state.
This is not the case for home-grown applications, where we have full control over the source code, the testing suite, the CI/CD pipeline, and the deployment automation.
These are all additional layers within the application layer. We need to monitor each of them to define quality gates, ensure that our application is fully tested before it reaches production, and maintain a paper trail of all test results for quality assurance and audit purposes.
After deployment, we need to have application telemetry in place to track the health and state of the application.
By instrumenting our application with one of the libraries provided by major monitoring solutions, we gain a wealth of information about the internal state of the service. Once again, we can see that the application itself behaves as an n-dimensional space.
So far, we have focused only on monitoring, but what applies to monitoring largely applies to logging as well. If we configure our log aggregation properly, logging becomes the second most valuable source of telemetry for our services and infrastructure.
Logging
In a very similar manner to the layers of monitoring, we can also have layers of logging. We have our log aggregators connected to all components of our infrastructure, services, and applications, and they are continuously shipping their logs to a centralised location where we can process them.
Even though the logging layers closely follow the monitoring layers, there are some notable differences.
First of all, in the majority of systems, we have first-party logging. While most services may not have a native integration with our monitoring system of choice, they do provide logging, which we can hook into our log forwarder.
This makes logging extremely valuable because, in many cases, it is the only source of first-party telemetry we have for a system.
Secondly, there is a difference in the dimensional analysis of the logs.
Log dimensional analysis
While monitoring is largely structured — with a well-defined format that allows us to locate specific metrics — logging is mostly unstructured.
Most of the time, logs are free‑form strings, and we need to use query languages to filter log messages and find those related to the service we are interested in.
Depending on the log aggregation system we use, we may be able to add some structure to the logs by classifying them according to severity, application, and subsystem.
By doing so, we add three dimensions in addition to the time dimension, making a total of four.
The complexity of logging, compared to monitoring metrics, shifts from the hierarchy of data to the contents of the logs themselves.
In practice, we often end up using regular expressions or query languages such as Lucene.
Because of their unstructured nature, most people use logs primarily during debugging to see what happened with a service, while relying on monitoring metrics to detect issues in the first place.
This is a valid use of logs, but we can do much more with them.
Having a data lake containing the logs of all your services is a gold mine. There are many ways to query this data lake for insights about your applications — but first, let’s discuss how we can convert unstructured data into semi‑structured data for easier processing.
Using AI with logs
First and foremost, we need to realise that we do not necessarily have to deal with unstructured logs. If we are talking about first‑party logs produced by our own services, then we can agree on a format that can be parsed relatively easily.
However, this will not solve every issue. We will still be using third‑party libraries that produce logs in a variety of formats, so we will not be able to create a single filter capable of extracting all the value from our logs.
Additionally, we will likely encounter the issue of misclassification — when useful information that should appear at a higher severity level is classified as DEBUG by the developer, without realising that this data will be filtered out in a production environment where only ERROR and above are forwarded to the log aggregator.
Furthermore, if we have a system with a relatively small deviation from a known format (e.g., Nginx or Apache logs), we can create regular expressions to target and extract the relevant data.
We can use AI for all these use cases — first, to detect misclassifications, and second, to identify log patterns.
After detecting misclassifications, we can either notify the developers who own the service so they can correct the classification, or, if the logs come from a third‑party service, create filters that ensure valuable operational data is not excluded.
Where logs meet monitoring
It is fair to ask — why are we doing this? The answer is that if we apply these filters, we can extract information from the logs and convert it into metrics.
Then we can feed those metrics into our monitoring solution and combine them with native monitoring data to create powerful queries.
Of course, these derived metrics will not be as timely as real‑time monitoring metrics, but as I mentioned previously, sometimes logging is the only source of first‑party telemetry we have.
In addition to this, the content of logs can have an arbitrary number of dimensions. This means that a single log message can contain one or more valuable fields of information, and this number is not fixed.
Performing an analysis to determine how many dimensions we can extract from each log message that can be converted to metrics and eventually provide valuable insights about the state of our service.
Again AI can be a valuable assistant in detecting these patterns.
Network monitoring
Network equipment monitoring can be approached in two ways.
We can either treat it like regular infrastructure monitoring — tracking standard metrics from each network device such as memory usage, CPU load, and packet counts in/out — or as network tracing, where we focus on tracking interactions rather than device metrics.
Both of these approaches are valuable. Tracing, in particular, can reveal previously unknown relationships between services, misconfigurations, or even security issues.
We can also combine tracing with logging to better understand how services interact with one another and the state they were in at the time.